Three-Step 9:30 Range Scalping# Three-Step 9:30 Range Scalping Strategy Rules
## Step 1: Mark the Levels (9:30 AM)
- Wait for the **first 5-minute candle** starting at 9:30 AM EST to close
- Mark the **HIGH** and **LOW** of this candle
- Switch to **1-minute chart** for trading
## Step 2: Find Your Entry (Trade for 1 hour only: 9:30-10:30 AM)
### BREAK Entry
- Need: **Fair Value Gap (FVG)** + **ANY** of the 3 FVG candles closes outside the range
- FVG = Gap between candle wicks (3-candle pattern)
### TRAP Entry
- Need: Break outside range → Retest back inside → Close back outside again
### REVERSAL Entry
- Need: Failed break in one direction → Opposite FVG back into the range
## Step 3: Trade Management
### Stop Loss:
- **Break/Trap**: Low/High of first candle that closed outside the range
- **Reversal**: Low/High of first candle in the FVG pattern
### Take Profit:
- **Always 2:1 risk-to-reward ratio**
- If you risk $100, you make $200
## Key Rules:
- ✅ **Body close** outside range (not just wicks)
- ✅ Trade on **1-minute chart** only
- ✅ Only trade **first hour** (9:30-10:30 AM EST)
- ✅ **Fixed 2:1** take profit every time
- ✅ One strategy, stay consistent
**That's it. No complicated indicators, no higher timeframe bias, no guesswork.**
"stop loss" için komut dosyalarını ara

Vesperis v8.1 by JaeheeVesperis v8.1 by Jaehee
Overview
This script is a short-side trading strategy designed for trend-following conditions where bearish momentum aligns across multiple independent filters. It does not aim to predict tops or bottoms. Instead, it waits for confirmation that the market has entered a strong downtrend and then manages trades with structured risk controls.
Core Components
The strategy combines several classical concepts but applies them in a multi-filter consensus framework to reduce false signals:
• SSL Hybrid Filter → Defines directional bias using an EMA-based signal line
• MOBO Bands (modified Bollinger framework) → Measures volatility compression and breakout expansion
• EMA 20/50/100 Alignment → Confirms bearish structure when shorter averages remain under longer ones
• ADX Strength Gate → Trades are permitted only when trend strength (Wilder’s ADX) is above a chosen threshold
• Heikin Ashi Smoothing → Provides visual clarity and reduces noise in trend recognition
• Cooldown Rule → After a losing trade, the system waits a configurable number of bars before re-entry to enforce discipline
Risk Management
• Take-Profit (TP) and Stop-Loss (SL) are dynamically attached to each entry
• TP and SL are ratio-based relative to the entry price
• Cooldown logic prevents immediate re-entries after losses
• Position sizing is based on percentage of equity, with commissions factored in for realistic simulation
Visualization
• EMA 20/50/100 ribbon with soft gradient colors
• MOBO band plotted with contrasting tones for clarity
• SSL baseline overlay
• ADX values displayed every 10 bars for contextual strength
• Background shading highlights bullish vs bearish trend regimes
• Heikin Ashi candle coloring for directional bias emphasis
Why This Combination?
Each component addresses a different market dimension:
• Direction (SSL, EMA alignment)
• Volatility & Breakout Context (MOBO Bands)
• Strength (ADX filter)
• Trade Discipline (Cooldown rule)
When layered together, they reduce the chance of acting on a single misleading condition. For example, a close under MOBO support is acted upon only if ADX confirms strong momentum and EMA structure validates a broader bearish regime. This multi-gate approach balances selectivity with responsiveness, aiming for consistent entries during trending phases rather than over-trading in sideways conditions.
Important Notes
• This script is a strategy, not just an indicator. It performs backtestable entries and exits within TradingView’s framework
• Default properties include realistic assumptions: commission, slippage approximation, and percentage-based position sizing
• Results will vary by market and timeframe; this tool does not guarantee outcomes and should be combined with independent risk management
• Invite-only access ensures controlled distribution
Compliance with TradingView House Rules
• No external links, promotions, or contact information
• Clear explanation of what, how, and why without revealing full code logic
• Highlights originality: consensus-based filter design with combined ADX, SSL, MOBO, EMA gating
• Provides conceptual and educational value to traders while remaining distinct from classic single-element scripts

Day Trading Strategy (With Risk Management)This is a day trading strategy based on fast and slow EMA crossovers combined with RSI filtering to enhance trade accuracy. Designed for intraday use, it generates buy signals when the fast EMA crosses above the slow EMA and sell signals when it crosses below, but only if the RSI confirms momentum is favorable to avoid false entries in choppy markets.
The strategy includes built-in risk management with configurable stop-loss and take-profit levels set at 1% by default, helping to limit losses and secure profits quickly within the trading day. Clear buy and sell signals are plotted on the chart, and alerts notify traders in real time when trading opportunities arise.
Ideal for short-term traders, this system provides a disciplined, mechanical approach to capturing intraday trends with momentum confirmation and essential risk controls. It is fully customizable to fit different day trading instruments, timeframes, and risk appetites.

BTC 1m Chop Top/Bottom Reversal (Stable Entries)Strategy Description: BTC 5m Chop Top/Bottom Reversal (Stable Entries)
This strategy is engineered to capture precise reversal points during Bitcoin’s choppy or sideways price action on the 5-minute timeframe. It identifies short-term tops and bottoms using a confluence of volatility bands, momentum indicators, and price structure, optimized for high-probability scalping and intraday reversals.
Core Logic:
Volatility Filter: Uses an EMA with ATR bands to define overextended price zones.
Momentum Divergence: Confirms reversals using RSI and MACD histogram shifts.
Price Action Filter: Requires candle confirmation in the direction of the trade.
Locked Signal Logic: Prevents repaints and disappearing trades by confirming signals only once per bar.
Trade Parameters:
Short Entry: Above upper band + overbought RSI + weakening MACD + bearish candle
Long Entry: Below lower band + oversold RSI + strengthening MACD + bullish candle
Take Profit: ±0.75%
Stop Loss: ±0.4%
This setup is tuned for traders using tight risk control and leverage, where execution precision and minimal drawdown tolerance are critical.

Intraday Momentum StrategyExplanation of the StrategyIndicators:Fast and Slow EMA: A crossover of the 9-period EMA over the 21-period EMA signals a bullish trend (long entry), while a crossunder signals a bearish trend (short entry).
RSI: Ensures entries are not in overbought (RSI > 70) or oversold (RSI < 30) conditions to avoid reversals.
VWAP: Acts as a dynamic support/resistance. Long entries require the price to be above VWAP, and short entries require it to be below.
Trading Session:The strategy only trades during a user-defined session (e.g., 9:30 AM to 3:45 PM, typical for US markets).
All positions are closed at the session end to avoid overnight risk.
Risk Management:Stop Loss: 1% below/above the entry price for long/short positions.
Take Profit: 2% above/below the entry price for long/short positions.
These can be adjusted via inputs for optimization.
Position Sizing:Fixed lot size of 1 for simplicity. Adjust based on your account size during backtesting.

Strategi FVG 09:31 (Pro)FVG 09:31 Strategy (Pro)
In short, this is an automated trading strategy (bot) for TradingView designed to execute buy or sell orders based on a Fair Value Gap (FVG) pattern. The strategy is highly specific, as it only triggers on the 1-minute timeframe and looks for an FVG that forms precisely at 09:32 AM New York time.
Main Purpose of the Strategy
The primary goal of this script is to identify and capitalize on short-term price imbalances, known as Fair Value Gaps (FVGs). It operates during a specific, high-volatility window right after the U.S. stock market opens, often referred to by traders as the "Silver Bullet" session. By automating the detection and execution, it aims to trade these fleeting opportunities with precision.
How the Strategy Works
The strategy follows a clear, step-by-step logical flow on your chart.
1. Time & Timeframe Restriction
1-Minute Timeframe: The strategy is hard-coded to work only on the 1-minute (1m) chart. A warning label will appear on your chart if you apply it to any other timeframe.
Specific Time Window: The core logic activates only between 09:32 and 09:33 AM New York time. It searches for an FVG pattern formed by the three candles from 09:29, 09:30, and 09:31, with the pattern confirmation happening on the close of the 09:31 candle.
2. Fair Value Gap (FVG) Detection
An FVG is a three-candle pattern that signals a price imbalance.
Bullish FVG (Potential Buy): Occurs when the low of the first candle is higher than the high of the third candle. The space between these two prices is the FVG zone.
Bearish FVG (Potential Sell): Occurs when the high of the first candle is lower than the low of the third candle. The space between these two prices is the FVG zone.
If this pattern is detected at the target time, the strategy draws a colored box on the chart to visualize the FVG zone (aqua for bullish, fuchsia for bearish).
3. Entry Logic
The strategy provides two user-selectable methods for entering a trade:
Retracement (Immediate Entry): The strategy will open a position with a market order as soon as the price retraces back into the identified FVG zone.
For a Bullish FVG, a Long (buy) position is opened when the price drops to touch the upper boundary of the FVG.
For a Bearish FVG, a Short (sell) position is opened when the price rises to touch the lower boundary of the FVG.
Limit Order (Pending Entry): The strategy places a pending limit order at the edge of the FVG zone.
For a Bullish FVG, a Buy Limit order is placed at the upper boundary of the FVG.
For a Bearish FVG, a Sell Limit order is placed at the lower boundary of the FVG.
Order Expiration: If the limit order is not filled within a specified number of candles (default is 15), it is automatically canceled to avoid chasing a stale setup.
4. Exit Logic
Once a position is active, the strategy automatically manages the exit by setting a Take Profit (TP) and Stop Loss (SL) level. You can choose between two types:
Ticks (Fixed Points): You define a fixed profit target and loss limit in ticks (the smallest price movement). For example, a 200-tick TP and a 100-tick SL.
Last Swing (Dynamic Levels): The TP and SL are set dynamically based on the most recent swing high or swing low.
For a Long position: Take Profit is set at the last swing high; Stop Loss is at the last swing low.
For a Short position: Take Profit is set at the last swing low; Stop Loss is at the last swing high.
5. Daily Management
At the start of each new trading day, the script performs a reset. All variables, including any FVG data from the previous day, are cleared. This ensures the strategy only acts on fresh signals from the current day and cancels any pending orders from the day before.
Explanation of Settings (Inputs)
Here is what each user-configurable setting does:
Entry Type: Choose your preferred entry method: Retracement or Limit Order.
Order Expiration (Candles): Applies only to the Limit Order type. Sets how many candles an unfilled order will remain active before being canceled.
Stop Loss Type: Choose Ticks for a fixed-distance stop loss or Last Swing for a dynamic level.
Take Profit Type: Choose Ticks for a fixed-distance profit target or Last Swing for a dynamic level.
Pivot Lookback (SL/TP Swing): Defines how many candles the script looks back to identify the most recent swing high/low for the Last Swing SL/TP type.
Contract Size: The quantity or lot size for each trade.
Take Profit (in Ticks): The profit target distance if using the Ticks type.
Stop Loss (in Ticks): The maximum loss distance if using the Ticks type.

DVPOOverview
The DVPO (Dynamic Volume Profile Oscillator) Strategy is a comprehensive and highly customizable trading tool designed for precision and control. It is built around a unique, volume-driven oscillator that identifies potential market entries by analyzing the relationship between price, volume, and volatility.
This strategy is not just another signal generator; it's a complete framework that includes dynamic entry logic, adaptive risk management (ATR Stop Loss and R:R-based Take Profit), and a powerful dashboard of 10+ optional confirmation filters to help you tailor the strategy to your specific instrument, timeframe, and trading style.
The Core Concept: The DVPO Oscillator
The heart of this strategy is the DVPO oscillator. Unlike standard oscillators like RSI or Stochastics, the DVPO's primary goal is to quantify how far the current price has deviated from its recent volume-weighted "fair value."
Here’s how it works conceptually:
Micro Volume Profile: The indicator first analyzes a recent period of bars (defined by Lookback Period) to build a mini-profile of price and volume.
Volume-Weighted Mean: From this profile, it calculates a volume-weighted average price (VWAP) and the average deviation from that mean. This establishes the central point of value for the recent period.
Deviation Measurement: The oscillator's value is derived from how far the current price is from this calculated mean, scaled by the observed price deviation and a user-defined Sensitivity. A value above the midline suggests the price is trading at a premium, while a value below suggests it's at a discount.
Adaptive Volatility Zones: Instead of using fixed overbought/oversold levels (e.g., 70/30), the DVPO calculates dynamic upper and lower zones using the standard deviation of the oscillator itself. These zones expand and contract based on recent market volatility.
An entry signal is triggered not just when the oscillator is "overbought" or "oversold," but when it breaks out of these adaptive volatility zones, signaling that a statistically significant price movement is underway.
📈 Long Entry Condition : The oscillator crosses above the dynamic upper zone.
📉 Short Entry Condition : The oscillator crosses below the dynamic lower zone.
Integrated Risk & Trade Management
A signal is useless without proper risk management. This strategy has professional-grade risk management built directly into its logic.
Stop Loss (ATR-Based): The Stop Loss is not a fixed percentage. It is calculated using the Average True Range (ATR), allowing it to adapt automatically to the market's current volatility. In volatile periods, the stop will be wider; in quiet periods, it will be tighter.
Take Profit (Risk/Reward Ratio): The Take Profit level is calculated based on a user-defined Risk/Reward Ratio. If you set a ratio of 2.0, the Take Profit target will be placed at twice the distance of the Stop Loss from your entry price.
Dynamic Position Sizing: The strategy can automatically calculate the trade quantity for you. It determines the position size based on your specified Capital Size and the % Risk Per Trade you are willing to accept, ensuring disciplined risk control on every trade.
The Filter Dashboard : Enhance Your Signal Quality
To help reduce false signals and adapt to different market conditions, the strategy includes a comprehensive dashboard of optional confirmation filters. An entry signal will only be executed if it aligns with all the filters you have activated.
Trend & Momentum Filters :
T3, VMA, & VWAP Trend Filters: Utilize a suite of advanced moving averages (T3, Variable Moving Average, and a session-based VWAP) to ensure your trades are aligned with the dominant trend.
ADX Filter: Confirms that the market has sufficient directional strength for a trend-following trade, helping to avoid entries during choppy conditions.
Kaufman Efficiency Filter: Uses the Kaufman Efficiency Ratio to measure market noise. It only allows trades when the market is trending efficiently.
Volume & Market State Filters :
Volume Flow (VFI): A sophisticated volume-based filter that confirms whether volume is supporting the price move.
TDFI (Trader's Dynamic Index): A market state indicator designed to identify when the market is primed for a strong, directional move.
Flat Market Detector: A unique filter that identifies and avoids trading in sideways or ranging markets where trend strategies typically underperform.
Trade Condition Filters :
Min TP / Max SL %: Filter out trades where the risk/reward profile doesn't meet your minimum requirements (e.g., ignore a trade if the ATR-based stop loss is more than 10% away from the price).
Session Filters: Allows you to enable or disable trading on specific days of the week and to set a Cooldown Period (a set number of bars to wait after a trade closes before looking for a new entry).
How To Use This Strategy
Start with the Core: Begin by configuring the DVPO Oscillator settings (Lookback Period, Sensitivity, Zone Width) and your Risk Management parameters (ATR Multiplier, RR Ratio, % Risk Per Trade). These form the foundation of the strategy.
Backtest and Observe: Use TradingView's Strategy Tester to see how the core signals perform on your chosen asset and timeframe.
Layer Filters Intelligently: Enable the confirmation filters one by one and re-run your backtest. Observe how each filter impacts performance (e.g., does the T3 filter increase profitability but reduce the number of trades?). The goal is to find the optimal balance between signal quality and frequency.
Visualize and Analyze: Use the Show Risk/Reward Area option to plot your entry, stop loss, and take profit levels directly on the chart for every trade, providing a clear visual representation of your trade plan.
Disclaimer: This strategy is provided for educational and analytical purposes only. Past performance is not indicative of future results. All trading involves risk, and you should conduct your own thorough backtesting and analysis before deploying any strategy in a live market.

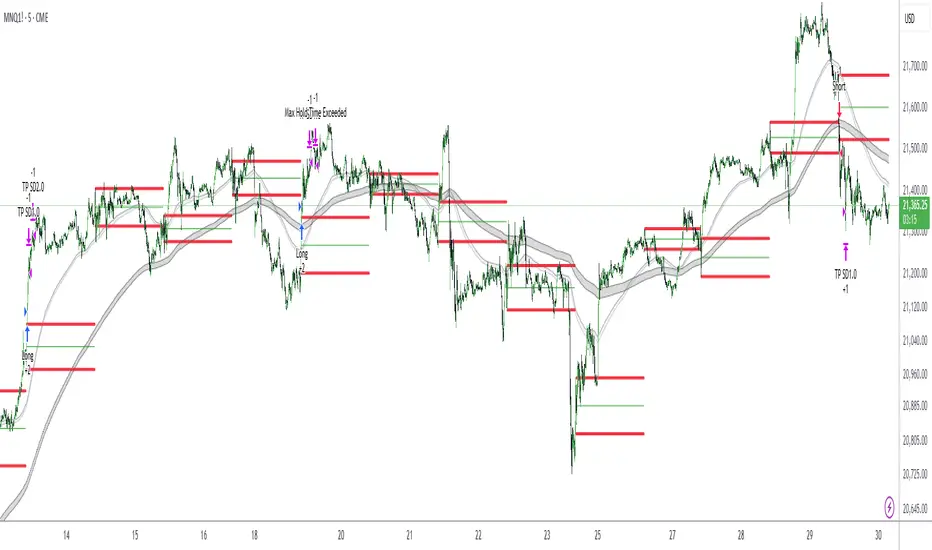
Antony.N4A -NQ ORB Quartile Str v6.3Antony.N4A – NQ ORB Quartile Strategy v6.3
A precision-engineered intraday breakout system built for the Nasdaq futures market, combining the Opening Range Breakout (ORB) logic with dynamic standard deviation targets, structural filters, and multi-layer risk management.
🧠 Key Features
Opening Range Breakout (ORB):
Automatically defines a breakout window (default: 09:30–09:45) and triggers entries when price breaks the high or low of that range.
Standard Deviation Profit Targets:
Supports SD0.5, SD1.0, SD1.5, and SD2.0 targets relative to the ORB range.
EMA Filtering (200-period):
Filters trades based on EMA direction and price position to validate breakout direction and avoid false entries.
Range Filtering:
Detects directional bias and volatility trends using smoothed range logic.
Momentum Triggering:
Validates breakout momentum and allows entries when directional momentum is positive and increasing.
⚙️ User Inputs
ORB Settings: Timeframe, session, and timezone customization
Entry Window: Define when trades are allowed to trigger
Day Filters: Enable/disable trading by weekday
SD Targets: Configure exit % and active levels (SD0.5 – SD2.0)
EMA Filter & Sensitivity
Cross Filter (Anti-chop logic)
Range Filter Parameters
Visual Toggles: ORB range, SD levels, EMA clouds
🎯 Trade Management Rules
Entry:
Triggered at the close of a 5-minute candle confirming a breakout of the ORB range.
Stop Loss:
Defined by structural invalidation (quartile boundaries & mid-range buffers).
Take Profit Strategy:
75% closed at SD1.0 level
Remaining 25% trailed to further SD2 target
SL is moved to breakeven after partial exit
Execution Controls:
No pyramiding
No re-entries (cooldown enforced)
🔧 Trading Modes
✅ Safe Mode
EMA Filter: Enabled
EMA Sensitivity: 19
Range Filter: Disabled
Ideal for conservative setups and reduced noise environments
🔥 Aggressive Mode
EMA Filter: Enabled
EMA Sensitivity: 5
Range Filter: Disabled
Suited for high-frequency setups and faster breakouts
📊 Backtest Performance (7-Month Sample)
Safe Mode:
Win Rate: 66%
Total Trades: 29
Net PnL: +21.79R (~$4,357 with R = $200)
Max Red Days: 3
Max Drawdown: -$663
Best Month: +9R, Worst Month: -2R
Aggressive Mode:
Win Rate: 63%
Total Trades: 52
Net PnL: +30R (~$6,080)
Max Red Days: 6
Max Drawdown: -$1,357
Best Month: +12R, Worst Month: -3.2R
👨💻 Developed by Antony.N4A
This tool is crafted for strategic intraday traders, system developers, and backtesters.
For access, customization, or licensing options, contact the developer directly.
Protected script. Redistribution or reuse without permission is prohibited.
ORB 5M + VWAP + Braid Filter + TP 2R o Niveles PreviosORB 5-Minute Breakout Strategy Summary
Strategy Name:
ORB 5M + VWAP + Braid Filter + TP 2R or Previous Levels
Timeframe:
5-minute chart
Trading Window:
9:35 AM to 11:00 AM (New York time)
✅ Entry Conditions:
Opening Range: Defined from 9:30 to 9:35 AM (first 5-minute candle).
Breakout Entry:
Long trade: Price breaks above the opening range high.
Short trade: Price breaks below the opening range low.
Confirmation Filters (All must be met):
Strong candle (green for long, red for short).
VWAP in the direction of the trade.
Braid Filter by Mango2Juice supports the breakout direction (green for long, red for short).
📉 Stop Loss:
Placed at the opposite side of the opening range.
🎯 Take Profit (TP):
+2R (Risk-to-Reward Ratio of 2:1),
or
Closest of the following: previous day’s high/low or premarket levels.
⚙️ Additional Rules:
Only valid signals between 9:35 and 11:00 AM.
Only one trade per breakout direction per day.
Filter out "trap candles" (very small or indecisive candles).
Avoid trading after 11:00 AM.
📊 Performance Goals:
Maintain a high Profit Factor (above 3 ideally).
Focus on tickers with good historical performance under this strategy (e.g., AMZN, PLTR, CVNA).

Cyber Strategy V1Сyber Strategy V1 – Indicator Testing & Strategy Execution Framework
✅ Overview
Cyber Strategy V1 is a closed-source strategy framework engineered to turn any of yours external indicator into a systematic, rule-based trading system. Designed for rigorous testing and live deployment, it combines multi-signal inputs, confirmations and automated execution paths to help traders and developers validate signal quality and manage risk with precision.
✅ Core Functionality
Multi-Source Independent Signal Inputs
Reversal Logic
Take Profit: up to 5 staggered TP levels, specified as percentage
Stop Loss: configurable via fixed percentage or dynamic SL that trails a reverse signals.
✅ Statistical Drawdown Analysis
For all profitable trades, tracks the maximum intratrade drawdown.
Computes percentile levels of profitable trades that hits minimum drawdowns to inform:
Entry buffer zones (e.g. avoid entering during transient noise)
Partial entry scaling prices.
✅ Signal Confirmation
Optional confirmation delays: hold entry until other signal section send a confirmation from another indicator.
✅ Automated Execution Integrations
Cornix Text Alerts: Generates pre-formatted alerts compatible with Cornix for semi-automated or bot trading.
Webhook Support: Emits JSON payloads on order-fill events to any endpoint, enabling full automation through third-party services or custom order-routing systems.
Important Notes
⚠️ THIS STRATEGY DOES NOT INCLUDE INDICATORS. Examples shown on screenshots use third-party tools. NO PROPRIETARY INDICATORS INCLUDED: Cyber Strategy V1 relies entirely on external signal inputs.
⚠️ All backtesting parameters are customizable; thorough backtesting under realistic slippage, fees and spread assumptions is essential before live deployment.

SMPivot Gaussian Trend Strategy [Js.K]This open-source strategy combines a Gaussian-weighted moving average with “Smart Money” swing-pivot breaks (BoS = Break-of-Structure) to capture trend continuations and early reversals. It is intended for educational and research purposes only and must not be interpreted as financial advice.
How the logic works
-------------------
1. Gaussian Moving Average (GMA)
• A custom Gaussian kernel (length = 30 by default) smooths price while preserving turning points.
• A second pass (“Smoothed GMA”) further filters noise; only its direction is used for bias.
2. Swing-Pivot detection
• High/Low pivots are found with a symmetric look-back/forward window (Pivot Length = 20).
• The most recent confirmed pivot creates a dynamic structure level (UpdatedHigh / UpdatedLow).
3. Entry rules
Long
• Price closes above the most recent pivot high **and** above Smoothed GMA.
Short
• Price closes below the most recent pivot low **and** below Smoothed GMA.
4. Exit rules
• Fixed stop-loss and take-profit in percent of current price (user-defined).
• Separate parameters and on/off switches for longs and shorts.
5. Visuals
• GMA (dots) and Smoothed GMA (line).
• Structure break lines plus “BoS PH/PL” labels at the midpoint between pivot and break.
Inputs
------
Gaussian
• Gaussian Length (default 30) – smoothing window.
• Gaussian Scatterplot – toggle GMA dots.
Smart-Money Pivot
• Pivot Length (default 20).
• Bull / Bear colors.
Risk settings
• Long / Short enable.
• Individual SL % and TP % (default 1 % SL, 30 % TP).
• Strategy uses percent-of-equity sizing; initial capital defaults to 10 000 USD.
Adjust these to reflect your own account size, realistic commission and slippage.
Best practice & compliance notes
--------------------------------
• Test on a data sample that yields ≥ 100 trades to obtain statistically relevant results.
• Keep risk per trade below 5–10 % of equity; the default values comply with this guideline.
• Explain any custom settings you publish that differ from the defaults.
• Do **not** remove the code header or licence notice (MPL-2.0).
• Include realistic commission and slippage in your back-test before publishing.
• The script does **not** repaint; orders are processed on bar close.
Usage
-----
1. Add the script to any symbol / timeframe; intraday and swing timeframes both work—adjust lengths accordingly.
2. Configure SL/TP and position size to match your personal risk management.
3. Run “List of trades” and the performance summary to evaluate expectancy; forward-test before live use.
Disclaimer
----------
Trading involves substantial risk. Past performance based on back-testing is not necessarily indicative of future results. The author is **not** responsible for any financial losses arising from the use of this script.

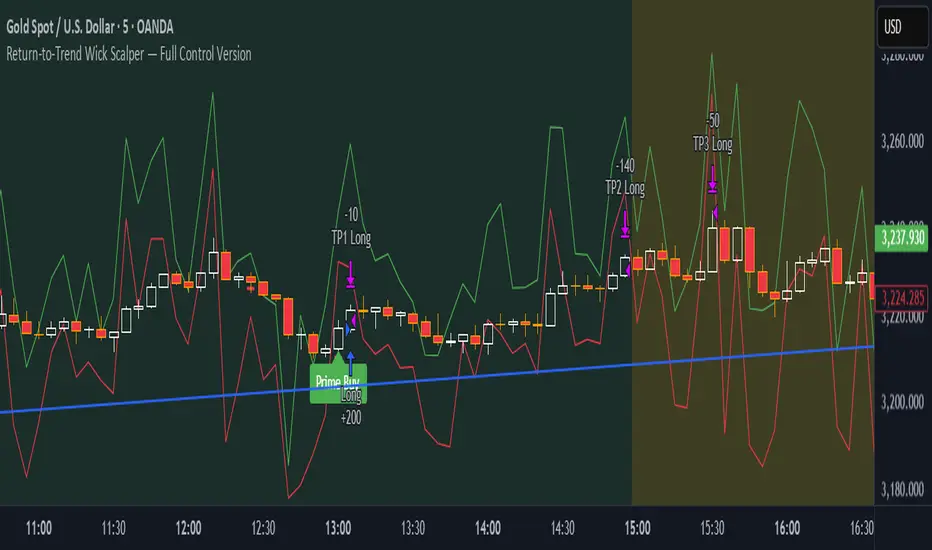
Return-to-Trend Wick Scalper — Full Control VersionReturn-to-Trend Wick Scalper — Modular Scalping Strategy for Gold (XAUUSD) & Indices
This is a precision-engineered scalping strategy designed primarily for high-volatility instruments such as Gold (XAUUSD), NASDAQ, and indices.
The system focuses on counter-trend pullbacks within the dominant daily trend, utilizing wick-based liquidity grabs (commonly referred to as “John Wick” candles) to identify high-probability return-to-trend opportunities.
Key Features:
✅ Dynamic Wick Reversal Detection: Detects reversal setups based on wick dominance and body ratio.
✅ Multiple Take Profit Levels: TP1, TP2, TP3 with individual enable/disable toggles and adjustable exit percentages.
✅ Time-Based Stop-Loss: Optional failsafe to close trades after exceeding a defined number of bars.
✅ VWAP Proximity Filter: Ensures entries happen near volume-weighted average price for precision.
✅ Pullback Depth Control: Filter for significant pullbacks using percentage of daily ATR.
✅ Dynamic Support & Resistance Validation: Confirms setups at key reactive levels.
✅ Volatility Filter: Avoids entries in overly volatile or dead market conditions.
✅ Aggressive Entry Mode: Optional early entry at pullback zones for faster fills.
✅ Paper Trading & Backtest Ready: Fully compatible with TradingView’s Paper Trading simulator.
Usage Notes:
Optimized for 5-minute chart entries.
Use in conjunction with Paper Trading for forward testing before live execution.
Can be connected to live brokers via alert webhooks and external bridges like PineConnector.
Instrument Focus:
Gold (XAUUSD) ✅
NASDAQ ✅
Dow Jones (US30) ✅
Other liquid indices ✅
Risk Note:
Always test thoroughly in Paper Trading before going live.
Optimize TP levels and filters according to market volatility conditions.
Designed for traders who want precision entries, flexibility in scaling out positions, and professional-grade risk control.
ZVGS Reactor🧠 ZVGS Reactor - High-Accuracy Trend Confirmation Strategy (Pine Script v6)
🚀 Overview
ZVGS Reactor is a precision-engineered, multi-layered trading strategy designed for crypto, forex, and equity markets. It blends adaptive trend tracking, directional strength confirmation, and volume validation to generate high-probability entries and exits. Built on a non-repainting foundation, the strategy ensures reliable performance in both backtesting and live trading environments.
🔹 How This Strategy Works (Indicator Fusion)
The ZVGS Reactor combines four core components:
1️⃣ ZLEMA Baseline for Trend Bias
📌 What It Does: Tracks the smoothed price trend and defines directional bias.
✔ Zero Lag Exponential Moving Average (ZLEMA)
Adaptive and responsive to price movement
Price above ZLEMA = bullish bias
Price below ZLEMA = bearish bias
2️⃣ Gradient Trend Filter for Momentum Slope
📌 What It Does: Measures slope strength to confirm directional momentum.
✔ Gradient Filter
Positive slope = bullish push
Negative slope = bearish pressure
3️⃣ Vortex Indicator (RMA Smoothed) for Trend Strength
📌 What It Does: Confirms whether the market is trending strongly in one direction.
✔ Vortex Indicator (VI)
VI+ > VI- = Bullish trend
VI- > VI+ = Bearish trend
Normalized & threshold-filtered for reliable confirmations
4️⃣ Volume Confirmation with Spike or Moving Average Toggle
📌 What It Does: Filters for strong market participation to reduce false breakouts.
✔ Volume Confirmation System
Spike Mode: Volume must exceed 1.5x its recent average
Toggle Option: Switch between spike mode and standard volume > average
Prevents entries in low-volume chop conditions
🎯 Entry & Exit Logic
✔ Long Entry (All Conditions Must Be Met):
Price above ZLEMA
Gradient slope > 0
Vortex confirms bullish strength
Volume passes confirmation filter
✔ Short Entry (All Conditions Must Be Met):
Price below ZLEMA
Gradient slope < 0
Vortex confirms bearish strength
Volume passes confirmation filter
✔ Exits (Fully Automated):
TP1: Close 50% at the first target
TP2: Fully exit at the second target
Stop Loss: Configurable SL included
🔧 Strategy Customization
All parameters are fully adjustable:
✅ ZLEMA length
✅ Volume confirmation mode (Spike or SMA)
✅ TP1/TP2/SL % levels
✅ Vortex length & threshold
✅ Gradient smoothing period
📈 Recommended Use Cases
Markets:
✅ Crypto (BTC, ETH, SOL, etc.)
✅ Forex (EUR/USD, GBP/JPY, etc.)
✅ Stocks & Indices (SPX, NASDAQ, DAX)
Timeframes:
✅ Swing: 1H – 4H – 1D
✅ Intraday: 5M – 15M – 30M
⚙️ Backtest Settings for Realistic Simulation
Initial Capital: $1,000
Commission: 0.05%
Slippage: 1
Date Filter: Built-in start and end time range
📢 TradingView Disclaimer
This script is for educational purposes only and does not constitute financial advice. Trading involves risk. Past performance is not indicative of future results. Always use demo testing before live deployment. Users are fully responsible for their own trading decisions.
🚀 Why Choose ZVGS Reactor?
✅ Zero-lag baseline with adaptive filtering
✅ Trend, strength, and volume confirmation
✅ Volume spike toggle for flexibility
✅ 100% Non-repainting — true signal stability
✅ Clean dashboard with real-time stats
✅ Works across all markets and timeframes
📢 Start Trading Smarter with ZVGS Reactor!
🔗 Use it on TradingView today and optimize your edge. 🔥

EMA 10/55/200 - LONG ONLY MTF (4h with 1D & 1W confirmation)Title: EMA 10/55/200 - Long Only Multi-Timeframe Strategy (4h with 1D & 1W confirmation)
Description:
This strategy is designed for trend-following long entries using a combination of exponential moving averages (EMAs) on the 4-hour chart, confirmed by higher timeframe trends from the daily (1D) and weekly (1W) charts.
🔍 How It Works
🔹 Entry Conditions (4h chart):
EMA 10 crosses above EMA 55 and price is above EMA 55
OR
EMA 55 crosses above EMA 200
OR
EMA 10 crosses above EMA 500
These entries indicate short-term momentum aligning with medium/long-term trend strength.
🔹 Confirmation (multi-timeframe alignment):
Daily (1D): EMA 55 is above EMA 200
Weekly (1W): EMA 55 is above EMA 200
This ensures that we only enter long trades when the higher timeframes support an uptrend, reducing false signals during sideways or bearish markets.
🛑 Exit Conditions
Bearish crossover of EMA 10 below EMA 200 or EMA 500
Stop Loss: 5% below entry price
⚙️ Backtest Settings
Capital allocation per trade: 10% of equity
Commission: 0.1%
Slippage: 2 ticks
These are realistic conditions for crypto, forex, and stocks.
📈 Best Used On
Timeframe: 4h
Instruments: Trending markets like BTC/ETH, FX majors, or growth stocks
Works best in volatile or trending environments
⚠️ Disclaimer
This is a backtest tool and educational resource. Always validate on demo accounts before applying to real capital. Do your own due diligence.

Crypto Strategy SUSDT 10 minThis strategy is designed to trade the **SUSDT** pair on a **10-minute time frame**, using a combination of an Exponential Moving Average (EMA) and percentage-based Stop Loss (SL) and Take Profit (TP) levels.
### How the strategy works:
1. **EMA Calculation**:
- The strategy calculates a 24-period Exponential Moving Average (EMA) based on the closing price.
- This EMA serves as the primary trend indicator.
2. **Entry Conditions**:
- **Long Position**: A long position is entered when the closing price is above the EMA and the opening price is below the EMA. This indicates a potential upward trend.
- **Short Position**: A short position is entered when the closing price is below the EMA and the opening price is above the EMA. This indicates a potential downward trend.
3. **Stop Loss and Take Profit**:
- Both Stop Loss (SL) and Take Profit (TP) are calculated based on the entry price of the position.
- **For Long Positions**:
- Stop Loss is set as a percentage below the entry price.
- Take Profit is set as a percentage above the entry price.
- **For Short Positions**:
- Stop Loss is set as a percentage above the entry price.
- Take Profit is set as a percentage below the entry price.
- The percentage values for SL and TP can be adjusted in the strategy's settings (default: SL = 2%, TP = 4%).
4. **Exit Conditions**:
- The position is closed automatically when either the Stop Loss or Take Profit level is reached.
5. **Visualization**:
- The 24-period EMA is plotted on the chart as a blue line, helping visualize the trend direction.
### Key Features:
- **Pair and Time Frame**: The strategy is optimized for the SUSDT pair on a 10-minute time frame.
- **Customizable Parameters**: Users can adjust the Stop Loss and Take Profit percentages to suit their risk tolerance and trading style.
- **Trend-Following Approach**: The strategy uses the EMA to identify and follow the current market trend.
This strategy is simple yet effective for capturing trends while managing risk through predefined Stop Loss and Take Profit levels.

Rally Base Drop SND Pivots Strategy [LuxAlgo X PineIndicators]This strategy is based on the Rally Base Drop (RBD) SND Pivots indicator developed by LuxAlgo. Full credit for the concept and original indicator goes to LuxAlgo.
The Rally Base Drop SND Pivots Strategy is a non-repainting supply and demand trading system that detects pivot points based on Rally, Base, and Drop (RBD) candles. This strategy automatically identifies key market structure levels, allowing traders to:
Identify pivot-based supply and demand (SND) zones.
Use fixed criteria for trend continuation or reversals.
Filter out market noise by requiring structured price formations.
Enter trades based on breakouts of key SND pivot levels.
How the Rally Base Drop SND Pivots Strategy Works
1. Pivot Point Detection Using RBD Candles
The strategy follows a rigid market structure methodology, where pivots are detected only when:
A Rally (R) consists of multiple consecutive bullish candles.
A Drop (D) consists of multiple consecutive bearish candles.
A Base (B) is identified as a transition between Rallies and Drops, acting as a pivot point.
The pivot level is confirmed when the formation is complete.
Unlike traditional fractal-based pivots, RBD Pivots enforce stricter structural rules, ensuring that each pivot:
Has a well-defined bullish or bearish price movement.
Reduces false signals caused by single-bar fluctuations.
Provides clear supply and demand levels based on structured price movements.
These pivot levels are drawn on the chart using color-coded boxes:
Green zones represent bullish pivot levels (Rally Base formations).
Red zones represent bearish pivot levels (Drop Base formations).
Once a pivot is confirmed, the high or low of the base candle is used as the reference level for future trades.
2. Trade Entry Conditions
The strategy allows traders to select from three trading modes:
Long Only – Only takes long trades when bullish pivot breakouts occur.
Short Only – Only takes short trades when bearish pivot breakouts occur.
Long & Short – Trades in both directions based on pivot breakouts.
Trade entry signals are triggered when price breaks through a confirmed pivot level:
Long Entry:
A bullish pivot level is formed.
Price breaks above the bullish pivot level.
The strategy enters a long position.
Short Entry:
A bearish pivot level is formed.
Price breaks below the bearish pivot level.
The strategy enters a short position.
The strategy includes an optional mode to reverse long and short conditions, allowing traders to experiment with contrarian entries.
3. Exit Conditions Using ATR-Based Risk Management
This strategy uses the Average True Range (ATR) to calculate dynamic stop-loss and take-profit levels:
Stop-Loss (SL): Placed 1 ATR below entry for long trades and 1 ATR above entry for short trades.
Take-Profit (TP): Set using a Risk-Reward Ratio (RR) multiplier (default = 6x ATR).
When a trade is opened:
The entry price is recorded.
ATR is calculated at the time of entry to determine stop-loss and take-profit levels.
Trades exit automatically when either SL or TP is reached.
If reverse conditions mode is enabled, stop-loss and take-profit placements are flipped.
Visualization & Dynamic Support/Resistance Levels
1. Pivot Boxes for Market Structure
Each pivot is marked with a colored box:
Green boxes indicate bullish demand zones.
Red boxes indicate bearish supply zones.
These boxes remain on the chart to act as dynamic support and resistance levels, helping traders identify key price reaction zones.
2. Horizontal Entry, Stop-Loss, and Take-Profit Lines
When a trade is active, the strategy plots:
White line → Entry price.
Red line → Stop-loss level.
Green line → Take-profit level.
Labels display the exact entry, SL, and TP values, updating dynamically as price moves.
Customization Options
This strategy offers multiple adjustable settings to optimize performance for different market conditions:
Trade Mode Selection → Choose between Long Only, Short Only, or Long & Short.
Pivot Length → Defines the number of required Rally & Drop candles for a pivot.
ATR Exit Multiplier → Adjusts stop-loss distance based on ATR.
Risk-Reward Ratio (RR) → Modifies take-profit level relative to risk.
Historical Lookback → Limits how far back pivot zones are displayed.
Color Settings → Customize pivot box colors for bullish and bearish setups.
Considerations & Limitations
Pivot Breakouts Do Not Guarantee Reversals. Some pivot breaks may lead to continuation moves instead of trend reversals.
Not Optimized for Low Volatility Conditions. This strategy works best in trending markets with strong momentum.
ATR-Based Stop-Loss & Take-Profit May Require Optimization. Different assets may require different ATR multipliers and RR settings.
Market Noise May Still Influence Pivots. While this method filters some noise, fake breakouts can still occur.
Conclusion
The Rally Base Drop SND Pivots Strategy is a non-repainting supply and demand system that combines:
Pivot-based market structure analysis (using Rally, Base, and Drop candles).
Breakout-based trade entries at confirmed SND levels.
ATR-based dynamic risk management for stop-loss and take-profit calculation.
This strategy helps traders:
Identify high-probability supply and demand levels.
Trade based on structured market pivots.
Use a systematic approach to price action analysis.
Automatically manage risk with ATR-based exits.
The strict pivot detection rules and built-in breakout validation make this strategy ideal for traders looking to:
Trade based on market structure.
Use defined support & resistance levels.
Reduce noise compared to traditional fractals.
Implement a structured supply & demand trading model.
This strategy is fully customizable, allowing traders to adjust parameters to fit their market and trading style.
Full credit for the original concept and indicator goes to LuxAlgo.

Bollinger Bands by Abu ElyasBollinger Bands with Adjustable Stop Loss (Long-Only)
This strategy uses a Bollinger Band breakout approach to enter long positions and incorporates an adjustable stop loss for risk management.
Below is an overview of the logic, parameters, and usage instructions.
1. Bollinger Bands Logic
Basis (Middle Band): A moving average (type selectable by the user) of the chosen source, typically the closing price.
Upper Band: The basis plus a specified number of standard deviations (user-defined multiplier).
Lower Band: The basis minus the same number of standard deviations.
2. Entry Triggers
The strategy enters a long position when the close price rises above the upper Bollinger Band , suggesting a potential bullish breakout.
This logic is only applied within a user-specified date range (adjustable in the strategy’s inputs).
3. Exit Triggers
1. Bollinger Band Exit:
If the close price drops below the lower Bollinger Band , the strategy closes the position, indicating a loss of bullish momentum.
2. Stop Loss Exit:
A default 8% stop loss is set, which automatically exits the trade if the close falls 8% below the entry price.
This stop-loss percentage is adjustable from the strategy’s settings, allowing users to tailor risk based on their preferences.
3. Date Range:
If the current bar is outside of the specified start/end dates, the strategy will also exit any open positions.
4. Position Sizing & Other Settings
1- Position Size:
By default, the script uses 100% of account equity for each trade.
2- Commissions & Slippage:
Commission is set to 0%, and slippage is set to 3 ticks.
3- Timeframe Handling:
You can select a custom timeframe or leave it blank to use the chart’s timeframe.
5. Customization
1. Bollinger Bands Parameters:
Length of the moving average, type of moving average (SMA, EMA, etc.), and the standard deviation multiplier can be adjusted.
2. Stop Loss (%)
The default stop loss of 8% can be changed in the script’s input settings to any percentage you prefer.
3. Date Filter:
Modify the start/end dates to control the historical period over which the strategy executes trades.
6. Notes & Best Practices
1- No Short Trades:
This is a long‐only strategy. It will either be in a long position or flat (no open position).
2- Risk Management:
An 8% stop loss may or may not align with your personal risk tolerance. Always adjust according to market conditions and your own trading style.
3- Market Gaps & Volatility:
In highly volatile markets, slippage or gaps can cause the actual exit price to be worse than the intended stop-loss level.
4- Test Thoroughly:
Backtest on different timeframes and market conditions. No single strategy works in all scenarios.
7. Disclaimer
Educational Use Only: This script is for informational and illustrative purposes and should not be considered financial advice.
No Guarantee of Profit: Past performance does not guarantee future results. Trading involves substantial risk, and it is possible to lose more than your initial investment.
Consult a Professional: Always consult a qualified financial advisor before making investment decisions.
Use this script as a foundation and personalize it based on your trading style, tolerance for drawdowns, and market conditions.

ICT NY Kill Zone Auto Trading### **ICT NY Kill Zone Auto Trading Strategy (5-Min Chart)**
#### **Overview:**
This strategy is based on Inner Circle Trader (ICT) concepts, focusing on the **New York Kill Zone**. It is designed for trading GBP/USD exclusively on the **5-minute chart**, automatically entering and exiting trades during the US session.
#### **Key Components:**
1. **Time Filter**
- The strategy only operates during the **New York Kill Zone (9:30 AM - 11:00 AM NY Time)**.
- It ensures execution only on the **5-minute timeframe**.
2. **Fair Value Gaps (FVGs) Detection**
- The script identifies areas where price action left an imbalance, known as Fair Value Gaps (FVGs).
- These gaps indicate potential liquidity zones where price may return before continuing in the original direction.
3. **Order Blocks (OBs) Identification**
- **Bullish Order Block:** Occurs when price forms a strong bullish pattern, suggesting further upside movement.
- **Bearish Order Block:** Identified when a strong bearish formation signals potential downside continuation.
4. **Trade Execution**
- **Long Trade:** Entered when a bullish order block forms within the NY Kill Zone and aligns with an FVG.
- **Short Trade:** Entered when a bearish order block forms within the Kill Zone and aligns with an FVG.
5. **Risk Management**
- **Stop Loss:** Fixed at **30 pips** to limit downside risk.
- **Take Profit:** Set at **60 pips**, providing a **2:1 risk-reward ratio**.
6. **Visual Aids**
- The **Kill Zone is highlighted in blue** to help traders visually confirm the active session.
**Objective:**
This script aims to **capitalize on institutional price movements** within the New York session by leveraging ICT concepts such as FVGs and Order Blocks. By automating trade entries and exits, it eliminates emotions and ensures a disciplined trading approach.

Custom Dual EMA Crossover Strategy with Configurable LogicThis strategy is designed to assist traders in identifying and capitalizing on bullish market trends through a systematic and data-driven approach. It incorporates detailed trend analysis, volatility filtering, and percentage-based thresholds to provide actionable insights and high-confidence trade setups. It leverages the Exponential Moving Average and combines it with custom logic to detect volatility, maximum allowed price movements over last bars and trend confirmation.
Key Features:
- Buy orders follow several conditions, including but not limited to:
a. EMA Crossover: specifically designed to capture immediate market shifts rather than medium- or long-term trends, ensuring responsiveness to rapidly changing conditions but requiring additional confirmations to avoid false signals (see below).
b. Thresholds in Price Changes: Ensures recent price fluctuations remain within specific thresholds, allowing trades to be entered at optimal times and avoiding delayed or unsustainable short-term bullish trends.
c. Adequate Market Volatility: Requires sufficient market activity to avoid false signals stemming from low volatility conditions.
d. Bullish Medium-Term Trend: Validates a bullish medium-term trend using an EMA crossover to avoid trading during bearish market conditions and minimize risk.
- Leverages Take profit and Stop loss levels
- Implements an optional mechanism to automatically close trades after a predefined number of bars, supporting disciplined trade management.
The script does not rely on any public scripts or indicators. Apart the EMA, all the underlying logic, including the volatility thresholds and filtering mechanisms, has been custom developed to ensure originality and precision. The strategy's conditions are all configurable by the user in the TradingView pop-up, allowing it to adapt to different assets and timeframes. For example, users can set the EMA lengths to align with long-term trends for cryptocurrencies or adjust volatility thresholds to account for the specific price movement behavior of stocks or forex pairs.
---
Recommendations:
- Identify a crypto asset with potential
- Before live trading, rigorously backtest your strategy on the chosen asset and interval over a period of at least one year*, analyzing results, refining parameters' value and eventually changing timeframe and / or asset.
- Refine your approach until you achieve consistent profitability with a high win rate. Balance the two — a high win rate is great, but only if your profits outweigh your losses in the long term.
- Once successful, remain disciplined and adhere to the parameters that yield the best results. Set up TradingView alerts to trigger real-time actions via your preferred trading bot. Alerts can be set up on the Indicator, which mirrors the strategy's logic and enables users to execute real-time actions effectively. I will provide you access to the Indicator, as well as the Strategy.
* Alternatively, you can apply the strategy to a shorter period for tactical use. While this approach may increase short-term opportunities (e.g. strong bullish short term movements), it also comes with heightened risks.
Use Cases:
- Suitable for traders focusing on bullish or range-bound markets.
- Ideal for short to medium-term trading horizons.
Access and Configuration Support:
This is an invite-only script. For access, please reach out directly for subscription details. I also provide guidance on configuring the strategy with real-world examples to optimize its use for various assets, intervals and timeframes.
---
Disclaimer:
This script is a tool to support trading decisions and does not guarantee profitability. Past performance does not indicate future results. Trading carries inherent risks; always trade responsibly and manage risk accordingly.
Bollinger Breakout Strategy with Direction Control [4H crypto]Bollinger Breakout Strategy with Direction Control - User Guide
This strategy leverages Bollinger Bands, RSI, and directional filters to identify potential breakout trading opportunities. It is designed for traders looking to capitalize on significant price movements while maintaining control over trade direction (long, short, or both). Here’s how to use this strategy effectively:
How the Strategy Works
Indicators Used:
Bollinger Bands:
A volatility-based indicator with an upper and lower band around a simple moving average (SMA). The bands expand or contract based on market volatility.
RSI (Relative Strength Index):
Measures momentum to determine overbought or oversold conditions. In this strategy, RSI is used to confirm breakout strength.
Trade Direction Control:
You can select whether to trade:
Long only: Buy positions.
Short only: Sell positions.
Both: Trade in both directions depending on conditions.
Breakout Conditions:
Long Trade:
The price closes above the upper Bollinger Band.
RSI is above the midline (50), confirming upward momentum.
The "Trade Direction" setting allows either "Long" or "Both."
Short Trade:
The price closes below the lower Bollinger Band.
RSI is below the midline (50), confirming downward momentum.
The "Trade Direction" setting allows either "Short" or "Both."
Risk Management:
Stop-Loss:
Long trades: Set at 2% below the entry price.
Short trades: Set at 2% above the entry price.
Take-Profit:
Calculated using a Risk/Reward Ratio (default is 2:1).
Adjust this in the strategy settings.
Inputs and Customization
Key Parameters:
Bollinger Bands Length: Default is 20. Adjust based on the desired sensitivity.
Multiplier: Default is 2.0. Higher values widen the bands; lower values narrow them.
RSI Length: Default is 14, which is standard for RSI.
Risk/Reward Ratio: Default is 2.0. Increase for more aggressive profit targets, decrease for conservative exits.
Trade Direction:
Options: "Long," "Short," or "Both."
Example: Set to "Long" in a bullish market to focus only on buy trades.
How to Use This Strategy
Adding the Strategy:
Paste the script into TradingView’s Pine Editor and add it to your chart.
Setting Parameters:
Adjust the Bollinger Band settings, RSI, and Risk/Reward Ratio to fit the asset and timeframe you're trading.
Analyzing Signals:
Green line (Upper Band): Signals breakout potential for long trades.
Red line (Lower Band): Signals breakout potential for short trades.
Blue line (Basis): Central Bollinger Band (SMA), helpful for understanding price trends.
Testing the Strategy:
Use the Strategy Tester in TradingView to backtest performance on your chosen asset and timeframe.
Optimizing for Assets:
Forex pairs, cryptocurrencies (like BTC), or stocks with high volatility are ideal for this strategy.
Works best on higher timeframes like 4H or Daily.
Best Practices
Combine with Volume: Confirm breakouts with increased volume for higher reliability.
Avoid Sideways Markets: Use additional trend filters (like ADX) to avoid trades in low-volatility conditions.
Optimize Parameters: Regularly adjust the Bollinger Bands multiplier and RSI settings to match the asset's behavior.
By utilizing this strategy, you can effectively trade breakouts while maintaining flexibility in trade direction. Adjust the parameters to match your trading style and market conditions for optimal results!

Harmony Signal Flow By ArunThis Pine Script strategy, titled "Harmony Signal Flow By Arun," uses the Relative Strength Index (RSI) indicator to generate buy and sell signals based on custom thresholds. The script incorporates stop-loss and target management and restricts new trades until the previous position closes. Here's a detailed description:
Custom RSI Metric:
The strategy calculates a 5-period RSI based on the closing price, aiming for a more responsive measure of price momentum.
RSI thresholds are defined:
Lower threshold (30): Indicates oversold conditions, triggering a potential buy.
Upper threshold (70): Indicates overbought conditions, prompting a possible sell.
Entry Conditions:
Buy Signal: The strategy initiates a buy order when the RSI crosses above the lower threshold (30), indicating a shift from oversold conditions.
Sell Signal: A sell order is triggered when the RSI crosses below the upper threshold (70), suggesting an overbought reversal.
Only one order (buy or sell) can be active at a time, ensuring that a new trade begins only when there’s no existing position.
Stop-Loss and Target Management:
For each trade, stop-loss and target conditions are applied to manage risk and secure profits.
For Buy Positions:
Stop-loss is set 100 points below the entry price.
Target is set 150 points above the entry price.
For Sell Positions:
Stop-loss is set 100 points above the entry price.
Target is 150 points below the entry price.
The strategy closes the trade when either the stop-loss or target is met, marking the trade as "closed" and allowing a new trade entry.
Trade Sequencing:
A new trade (buy or sell) is only permitted after the previous position hits either its stop-loss or target, preventing overlapping trades and ensuring clear trade sequences.
This sequential approach enhances risk management by ensuring only one active position at any time.
End-of-Day Closure:
All open positions are closed automatically at 3:25 PM (Indian market time) to avoid overnight exposure, ensuring the strategy remains strictly intraday.
The flag for trade entry is reset at the end of each day, enabling fresh trades the next day.
Chart Indicators:
The script plots buy and sell signals directly on the chart with visible labels.
It also displays the custom RSI metric with horizontal lines for the lower and upper thresholds, providing visual cues for entry and exit points.
Summary
This strategy is a momentum-based intraday trading approach that uses the RSI for identifying potential reversals and manages trades through predefined stop-loss and target levels. By enforcing trade sequencing and closing positions at the end of the trading day, it prioritizes risk management and seeks to capitalize on short-term trends while avoiding overnight market risks.

Supertrend StrategyThe Supertrend Strategy was created based on the Supertrend and Relative Strength Index (RSI) indicators, widely respected tools in technical analysis. This strategy combines these two indicators to capture market trends with precision and reliability, looking for optimizing exit levels at oversold or overbought price levels.
The Supertrend indicator identifies trend direction based on price and volatility by using the Average True Range (ATR). The ATR measures market volatility by calculating the average range between an asset’s high and low prices over a set period. It provides insight into price fluctuations, with higher ATR values indicating increased volatility and lower values suggesting stability. The Supertrend Indicator plots a line above or below the price, signaling potential buy or sell opportunities: when the price closes above the Supertrend line, an uptrend is indicated, while a close below the line suggests a downtrend. This line shifts as price movements and volatility levels change, acting as both a trailing stop loss and trend confirmation.
To enhance the Supertrend strategy, the Relative Strength Index (RSI) has been added as an exit criterion. As a momentum oscillator, the RSI indicates overbought (usually above 70) or oversold (usually below 30) conditions. This integration allows trades to close when the asset is overbought or oversold, capturing gains before a possible reversal, even if the percentage take profit level has not been reached. This mechanism aims to prevent losses due to market reversals before the Supertrend signal changes.
### Key Features
1. **Entry criteria**:
- The strategy uses the Supertrend indicator calculated by adding or subtracting a multiple of the ATR from the closing price, depending on the trend direction.
- When the price crosses above the Supertrend line, the strategy signals a long (buy) entry. Conversely, when the price crosses below, it signals a short (sell) entry.
- The strategy performs a reversal if there is an open position and a change in the direction of the supertrend occurs
2. **Exit criteria**:
- Take profit of 30% (default) on the average position price.
- Oversold (≤ 5) or overbought (≥ 95) RSI
- Reversal when there is a change in direction of the Supertrend
3. **No Repainting**:
- This strategy is not subject to repainting, as long as the timeframe configured on your chart is the same as the supertrend timeframe .
4. **Position Sizing by Equity and risk management**:
- This strategy has a default configuration to operate with 35% of the equity. At the time of opening the position, the supertrend line is typically positioned at about 12 to 16% of the entry price. This way, the strategy is putting at risk about 16% of 35% of equity, that is, around 5.6% of equity for each trade. The percentage of equity can be adjusted by the user according to their risk management.
5. **Backtest results**:
- This strategy was subjected to deep backtesting and operations in replay mode, including transaction fees of 0.12%, and slippage of 5 ticks.
- The past results in deep backtest and replay mode were compatible and profitable (Variable results depending on the take profit used, supertrend and RSI parameters). However, it should be noted that few operations were evaluated, since the currency in question has been created for a short time and the frequency of operations is relatively small.
- Past results are no guarantee of future results. The strategy's backtest results may even be due to overfitting with past data.
Default Settings
Chart timeframe: 2h
Supertrend Factor: 3.42
ATR period: 14
Supertrend timeframe: 2 h
RSI timeframe: 15 min
RSI Lenght: 5 min
RSI Upper limit: 95
RSI Lower Limit: 5
Take Profit: 30%
BYBIT:1000000MOGUSDT.P

MACD Trend Trading with Dynamic Position Sizing // AlgoFyreThe MACD Trend Trading with Dynamic Position Sizing strategy combines MACD and trend indicators for trend trading. It uses MACD crossovers to identify entry points and a trend source for directional bias. The strategy incorporates risk management through dynamic position sizing based on a fixed risk amount. It allows for both long and short positions with customizable stop-loss and take-profit levels. The script includes visualization options for entry, stop-loss, and take-profit levels, enhancing trade analysis.
TABLE OF CONTENTS
🔶 ORIGINALITY
🔸Dynamic Position Sizing
🔸Trend-MACD Combination
🔸Customizable Risk Management
🔶 FUNCTIONALITY
🔸Indicators
🞘 Trend Indicator
🞘 Moving Average Convergence Divergence (MACD)
🔸Conditions
🞘 Long Entry
🞘 Short Entry
🔶 INSTRUCTIONS
🔸Step-by-Step Guidelines
🞘 Setting Up the Strategy
🞘 Alerts
🔸Customize settings
🔶 CONCLUSION
▅▅▅▅▅▅▅▅▅▅▅▅▅▅▅▅▅▅▅▅▅▅▅▅▅▅▅▅▅▅▅▅▅▅▅▅▅▅▅▅▅▅▅▅▅
🔶 ORIGINALITY The MACD Trend Trading with Dynamic Position Sizing strategy uniquely combines MACD indicators with trend analysis to optimize entry and exit points. Unlike static trading strategies, it employs dynamic position sizing based on a fixed risk amount, ensuring consistent risk management. This approach allows traders to adapt to varying market conditions by adjusting position sizes according to predefined risk parameters, enhancing both flexibility and control in trading decisions. The strategy's integration of customizable stop-loss and take-profit levels further refines its risk management capabilities, making it a robust tool for both trending and volatile markets.
🔸Dynamic Position Sizing This strategy calculates position sizes dynamically, based on a fixed risk amount, allowing traders to maintain consistent risk exposure across trades.
🔸Trend-MACD Combination By combining trend direction with MACD crossovers, the strategy enhances the accuracy of entry signals, aligning trades with prevailing market trends.
🔸Customizable Risk Management Traders can set flexible risk-reward ratios and adjust stop-loss and take-profit levels, tailoring the strategy to their risk tolerance and market conditions.
🔶 FUNCTIONALITY The MACD Trend Trading with Dynamic Position Sizing strategy leverages a combination of trend indicators and the MACD to identify optimal trading opportunities. This strategy is designed to capitalize on short-term price movements by dynamically adjusting position sizes based on predefined risk parameters. It allows traders to manage risk effectively while taking advantage of both long and short positions.
🔸Indicators 🞘 Trend Indicator: Utilizes the trend source to determine market direction, ensuring trades align with prevailing trends.
Recommendation: We recommend using the Adaptive MAs (Hurst, CVaR, Fractal) indicator with the following settings for trend detection. However, you can use any trend indicator that suits your trading style.
🞘 Moving Average Convergence Divergence (MACD): Employs MACD crossovers to generate entry signals, enhancing the accuracy of trade execution. Use the "Moving Average Convergence Divergence" Indicator with the following settings:
🔸Conditions 🞘 Long Entry: Initiates a long position when the price is above the trend source, and a MACD crossover occurs with both MACD and signal lines below zero.
🞘 Short Entry: Initiates a short position when the price is below the trend source, and a MACD crossunder occurs with both MACD and signal lines above zero.
🔶 INSTRUCTIONS
The MACD Trend Trading with Dynamic Position Sizing strategy can be set up by adding it to your TradingView chart and configuring parameters such as the MACD source, trend source, and risk management settings. This strategy is designed to capitalize on short-term price movements by dynamically adjusting position sizes based on predefined risk parameters. Enhance the accuracy of signals by combining this strategy with additional indicators like trend-following or momentum-based tools. Adjust settings to better manage risk and optimize entry and exit points.
🔸Step-by-Step Guidelines
🞘 Setting Up the Strategy
Adding the Strategy to the Chart:
Go to your TradingView chart.
Click on the "Indicators" button at the top.
Search for "MACD Trend Trading with Dynamic Position Sizing" in the indicators list.
Click on the strategy to add it to your chart.
Configuring the Strategy:
Open the strategy settings by clicking on the gear icon next to its name on the chart.
MACD: Select the MACD from the MACD Indicator.
MACD Signal: Select the MACD Signal from the MACD Indicator.
Trend Source: Choose the trend source to determine market direction. If you use the Adaptive MAs (Hurst, CVaR, Fractal) with our settings shown above, choose the MA1 Smoothing Line.
Stop Loss Percentage: Set the stop loss distance from the trend source as a percentage.
Risk/Reward Ratio: Define the desired risk/reward ratio for trades.
Backtesting and Practice:
Backtest the strategy on historical data to understand how it performs in various market environments.
Practice using the strategy on a demo account before implementing it in live trading.
Market Awareness:
Keep an eye on market news and events that might cause extreme price movements. The strategy reacts to price data and might not account for news-driven events that can cause large deviations.
🔶 CONCLUSION
The MACD Trend Trading with Dynamic Position Sizing strategy provides a robust framework for capitalizing on short-term market trends by combining the MACD indicator with dynamic position sizing. This strategy leverages MACD crossovers to identify entry points and utilizes a trend source for directional bias, ensuring trades align with prevailing market conditions. By incorporating dynamic position sizing based on a fixed risk amount, traders can effectively manage risk and adapt to varying market conditions. The strategy's customizable stop-loss and take-profit levels further enhance its risk management capabilities, making it a versatile tool for both trending and volatile markets. With its strategic blend of technical indicators and risk management, the MACD Trend Trading strategy offers traders a comprehensive approach to optimizing trade execution and maximizing potential returns.
